Bitcoin Consolidates Near $80,000: Is a New Bottom Taking Shape?

Bitcoin is attempting to stabilize above the key psychological level of $80,000, but lingering economic uncertainty, a broader downtrend, and waning ETF demand continue to limit a full recovery.
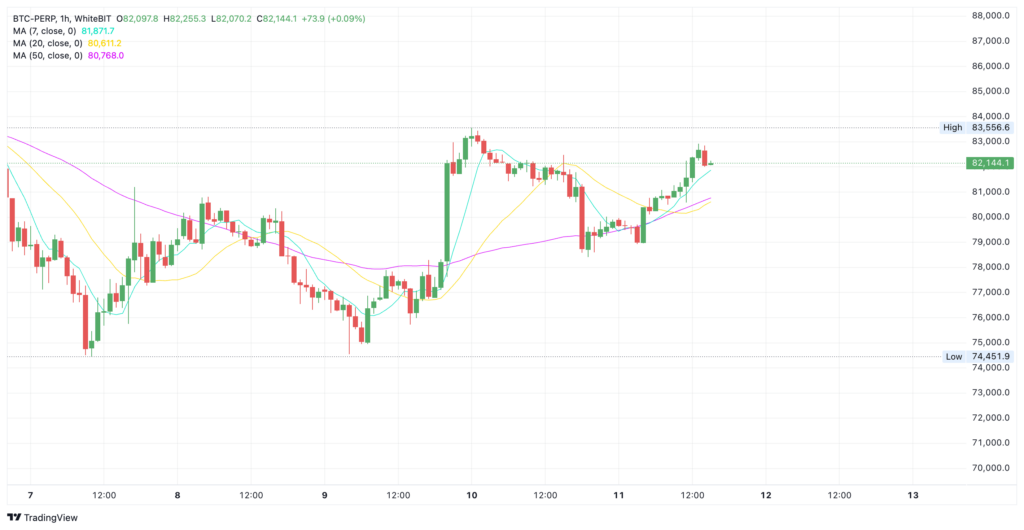
Over the past 24 hours, BTC briefly dropped 4.5% before rebounding sharply to reclaim the $81,000 level. The price swings come amid growing tension over U.S. trade policy and China's increasingly aggressive response.
Tariff war updates are coming in almost daily.
Data from CoinGlass shows that $312 million in margin positions were liquidated over the past 24 hours, with $175 million tied to long trades.
Traders with different strategies are incurring similar losses as they scramble to enter the market, afraid they’ll miss out if they don’t act fast.
Related: Will There Be a Recession in 2025? Markets, Data, and Trump’s Tariffs
- The Fear and Greed Index has moved out of the extreme fear zone but remains near the bottom (21).
- Bitcoin dominance holds steady at 62.7%.
- The Altcoin Season Index is at 17, underscoring Bitcoin’s strength over altcoins.
While a few tokens have shown short-term upward moves, there’s no clear sign of a broader altcoin rally yet.
Downtrend Stalls Bitcoin Recovery
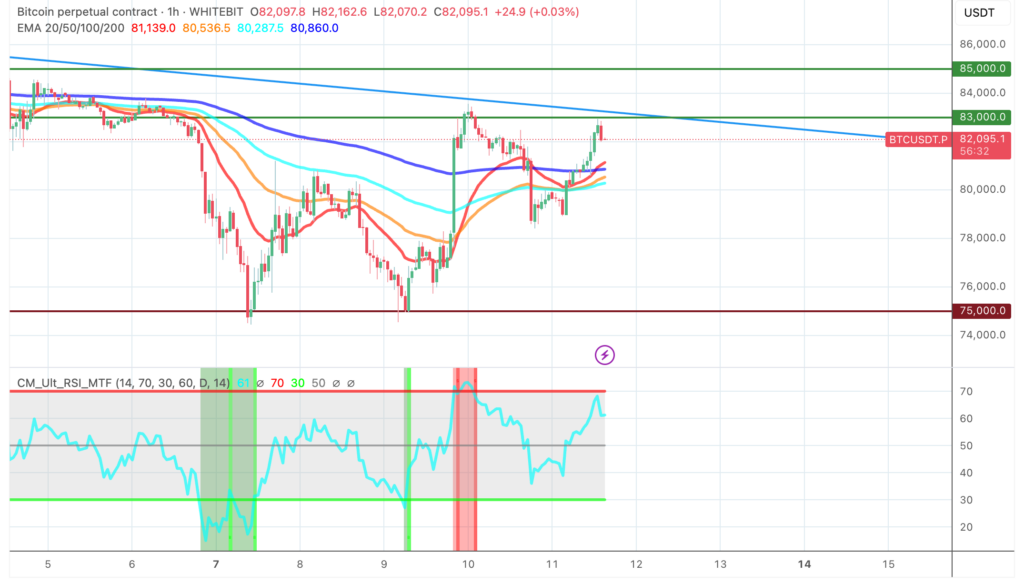
As mentioned in yesterday’s market overview, Bitcoin must clear the resistance levels at $83,000 and $85,000 and hold above the latter to regain bullish momentum.
However, a prolonged downward trend continues to hold back progress, and breaking through it may prove difficult.
At the same time, the daily RSI indicator is pushing toward its midpoint, which often signals growing buyer pressure and a possible trend reversal.
However, 10x Research analyst Markus Thielen says it’s still too early to make optimistic predictions. He notes that the recent growth in BTC was driven by U.S. investors looking for safe-haven assets amid a weakening dollar. The 90-day tariff truce was intended to reduce U.S. Treasury yields, but backfired as yields began climbing again.
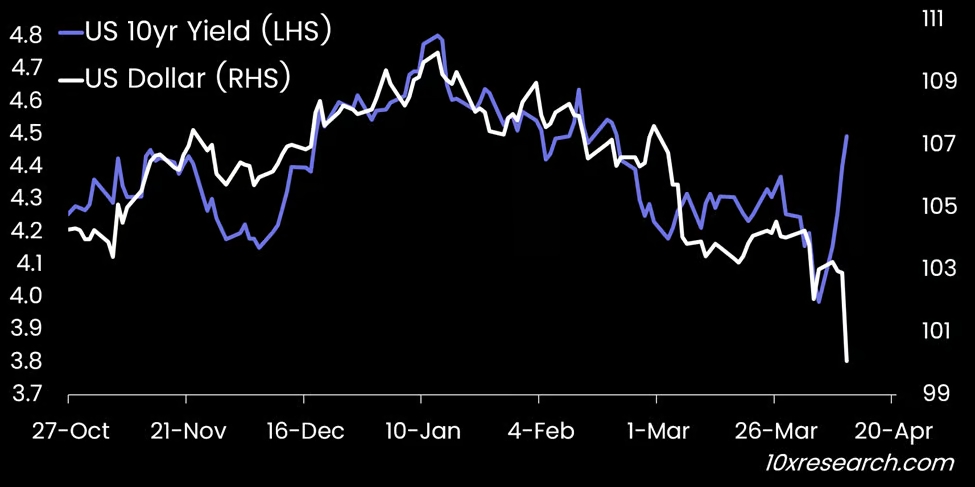
- Note: Bond yields respond to the Fed’s key interest rate and investor demand. Long-term bonds, in particular, reflect market expectations around Fed policy and current buying activity. When demand drops, bond prices fall and yields rise. At present, the 10-year bond yield has climbed above 4.4% annually, with the ATH at 5.02%.
Bitcoin ETF Outflows Continue
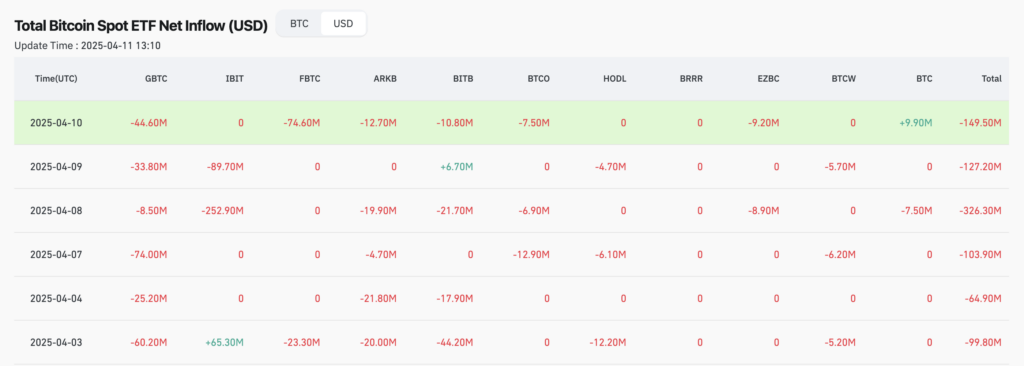
Bitcoin may be up nearly 9% in recent days, but institutional investors are still pulling capital from U.S. spot Bitcoin ETFs. On April 10, 2025, total net outflows reached $149.5 million.
Fidelity Physical Bitcoin ETP (FBTC) took the biggest hit, losing $74.6 million.
Although the U.S. paused its tariff policy for most countries two days ago, this marks the sixth straight day of outflows, averaging over $100 million per session.
Analyst Opinions
John Bollinger, the creator of the Bollinger Bands technical indicator, believes Bitcoin is setting a classic bottom near the $80,000 level, based on weekly chart patterns. However, he clarified that the setup is still in progress and needs confirmation, urging traders to remain cautious.
Jurrien Timmer, Director of Global Macro at Fidelity Investments, agrees with Bollinger’s outlook. He came to a similar conclusion after analyzing the U.S. S&P 500 index. In his view, traditional markets look oversold, potentially creating buying opportunities. Still, he noted that technical indicators have not yet reached their historical lows.
Read more: Ethereum vs Bitcoin: Key Differences Explained
Economist Timothy Peterson, who had earlier forecast a 95% chance that Bitcoin would stay above $69,000 (yet to be breached), now expects a rebound once traditional markets stabilize. He also noted that Bitcoin was the first risk asset to react negatively following the early phase of the U.S. tariff standoff.
Bitcoin led NASDAQ on this decline. As the asset perceived to be at the top of the risk pyramid, I would expect NASDAQ to rally first, and then Bitcoin. Just something to look for. But I think NASDAQ has another -10% to fall,
Peterson said.
As more analysts weigh in, many now believe that the $70,000–$80,000 range is shaping up to be Bitcoin’s new bottom.
Looking ahead, resistance remains at $83,000 and $85,000, while $75,000 stands out as a key support level with both technical relevance and psychological weight as a round-number benchmark.
The content on The Coinomist is for informational purposes only and should not be interpreted as financial advice. While we strive to provide accurate and up-to-date information, we do not guarantee the accuracy, completeness, or reliability of any content. Neither we accept liability for any errors or omissions in the information provided or for any financial losses incurred as a result of relying on this information. Actions based on this content are at your own risk. Always do your own research and consult a professional. See our Terms, Privacy Policy, and Disclaimers for more details.
Articles by this author