Weekly Analysis of BTC, ETH, and the Stock Market (Jan 13, 2025)

An overview of BTC, ETH, XAUT, and S&P500 charts, and the current cryptocurrency market dynamics.
On this page
Bitcoin (BTC)
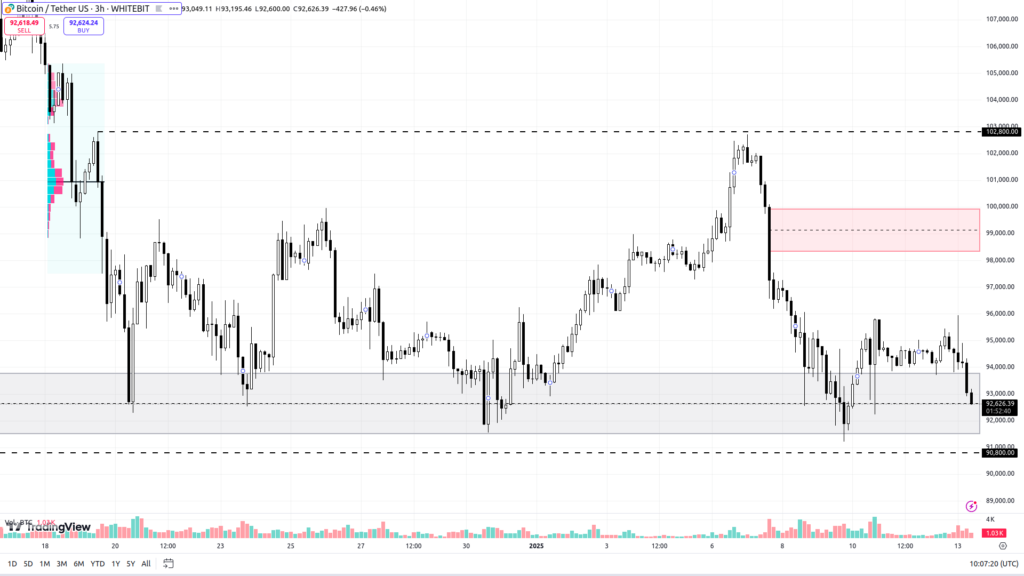
Bitcoin’s sharp correction and temporary breach of the $90,000 support level haven’t altered its global dynamics. The price continues to fluctuate between the $91,500–$93,700 support zone and resistance at $98,300–$99,900.
With the inauguration of the U.S. president on January 20, market volatility is expected to rise, a factor traders should account for in their strategies. Should buyers regain momentum, BTC could resume its climb toward the $98,300–$99,900 resistance and potentially reach the $102,800 seller zone.
Ethereum (ETH)
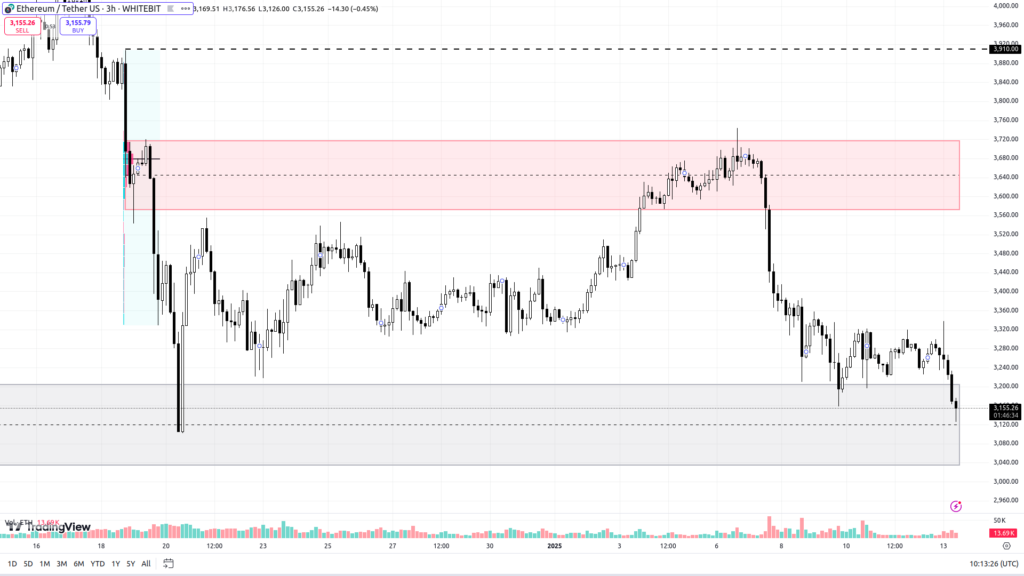
ETH is trading within its established support zone of $3,035–$3,200, and its next direction will be shaped by the broader crypto market trends.
On Monday, the support range faced intense selling pressure, but Ethereum showed resilience. Such price actions could reflect manipulation ahead of Trump’s inauguration.
A bounce back could push Ethereum to retest the $3,570–$3,720 resistance zone, potentially reinforcing its long-term upward trend.
S&P 500 (SPX)
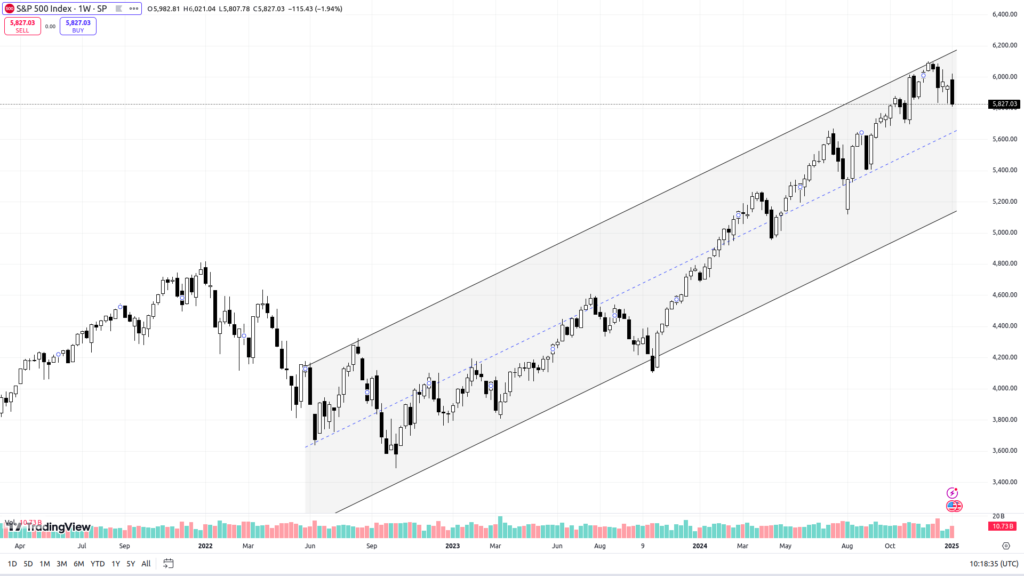
The S&P 500 closed below $5,830 last week for the first time since mid-November. Despite this dip, the index is still trading within an ascending channel, indicating that this should be viewed as a short-term correction.
Should the index continue its downward trajectory this week, it may retest the mid-channel support near $5,650. This could present a strategic opportunity for institutional investors to accumulate long positions.
The ultimate target of the uptrend is to break above $6,100 and set a new ATH.
Tether Gold (XAUT)
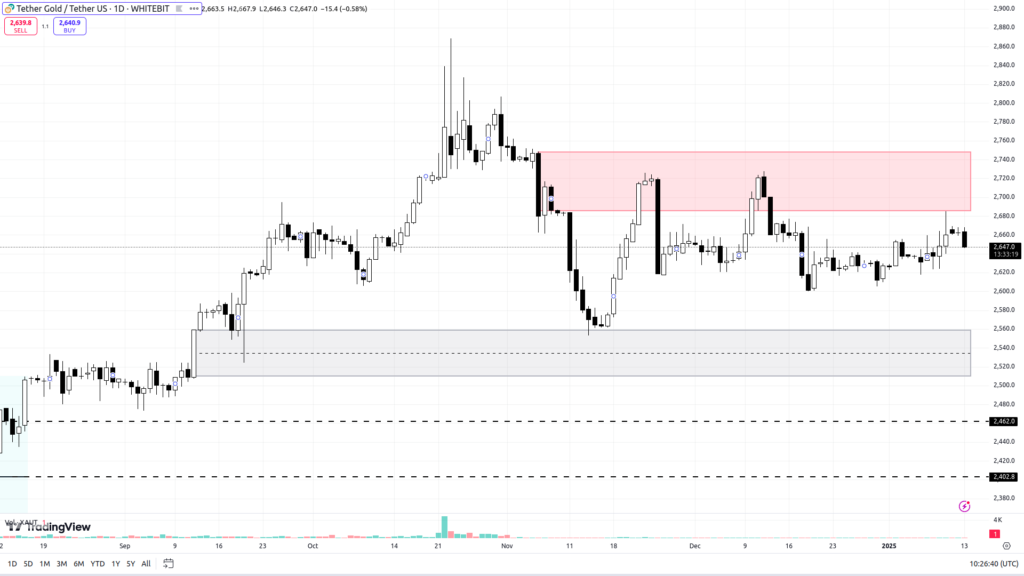
Trading within a horizontal channel, gold holds steady between $2,510–$2,560 as support and $2,685–$2,750 as resistance. Although the asset is in a long-term uptrend, the near-term direction is uncertain.
Failure to test recent highs could push XAUT down toward local lows at $2,462 and $2,402.
BTC Dominance, Altcoin Season Index, and Fear and Greed Index
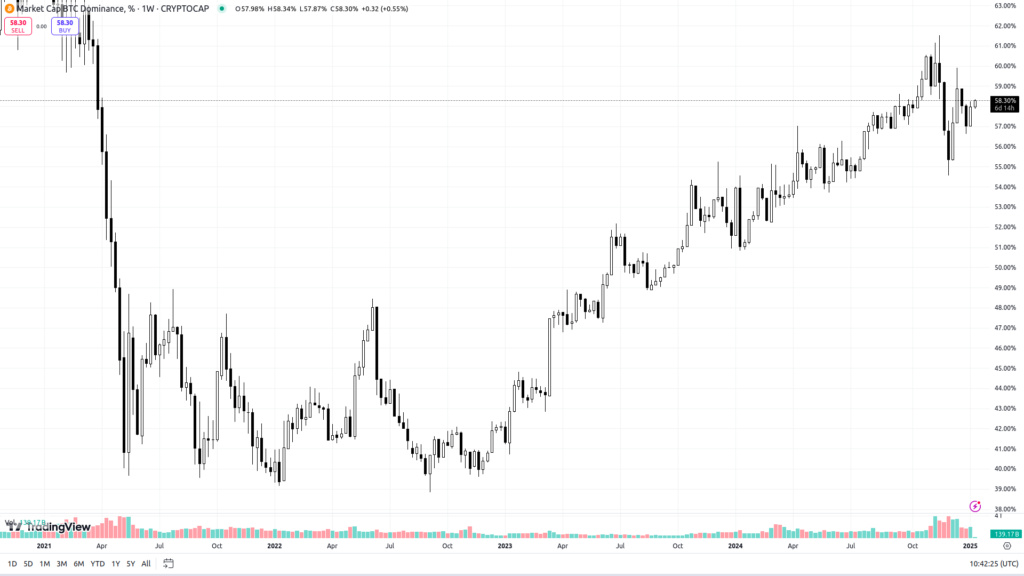
Bitcoin dominance is holding at 58.31%, showing a clear preference among investors for BTC, with altcoins largely overlooked.
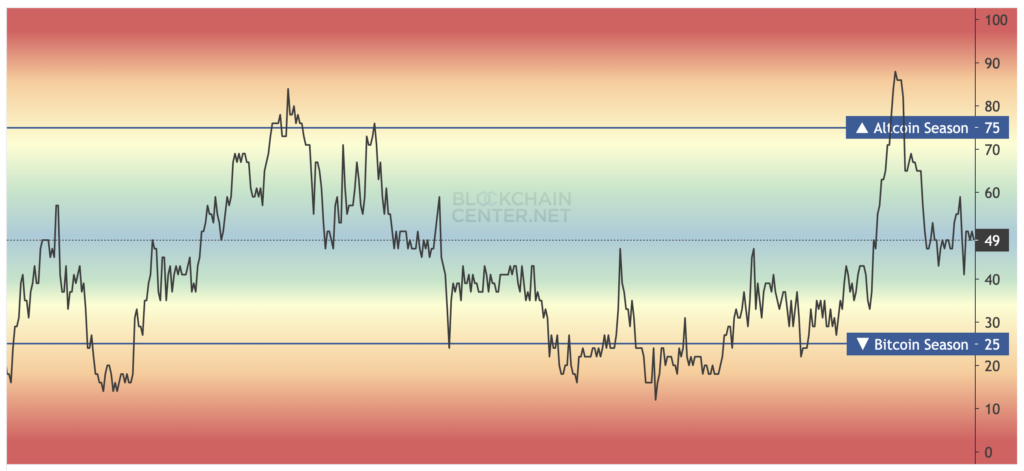
The altcoin season index reads 49, suggesting that alternative coins play a minor role in most investment portfolios.
The Fear and Greed Index, currently at 61 (“Greed”), reflects an optimistic market mood. However, cautious sentiment is creeping in, as evidenced by the index’s three-week decline.

Macroeconomic News to Watch This Week
This week’s macroeconomic updates include:
- U.S. Producer Price Index (Tuesday, January 14);
- Consumer Price Index and Crude Oil Inventory Levels (Wednesday, January 15);
- Core Retail Sales, Unemployment Benefit Claims, and Retail Sales in the U.S. (Thursday, January 16).
The highlight of the week is Wednesday’s release of the Consumer Price Index, which will provide a key indicator of inflation in the U.S. Cryptocurrency traders should keep a close watch, as it may shape market dynamics.
Check out The Coinomist for the latest cryptocurrency rates and chart analysis.
Disclaimer
Please note that the analysis provided above should not be considered a trading recommendation. Before opening any deals, we strongly advise conducting your own research and analysis.
Abbreviations
TF (Timeframe) — a chronological period equal to the time it takes to form one Japanese candle on the chart.
Horizontal channel (flat, sideways, range) — the price movement between support and resistance levels, without going beyond the given range.
К — simplified designation of one thousand dollars of the asset price (for example, 23.4K – $23,400).
Gray range on the chart — a support zone.
Red range on the chart — a resistance zone.
Correlation — the tendency of prices of different cryptocurrencies to move in sync, often influenced by the dominance of one of the assets.
Initial materials
This analysis was informed by the following educational materials and articles from The Coinomist:
The content on The Coinomist is for informational purposes only and should not be interpreted as financial advice. While we strive to provide accurate and up-to-date information, we do not guarantee the accuracy, completeness, or reliability of any content. Neither we accept liability for any errors or omissions in the information provided or for any financial losses incurred as a result of relying on this information. Actions based on this content are at your own risk. Always do your own research and consult a professional. See our Terms, Privacy Policy, and Disclaimers for more details.


